This will help you interpret the GBVF Health Check data for your organisation and present its results to the leadership group, allowing them to decide on a focus area for the 30-Day Project.
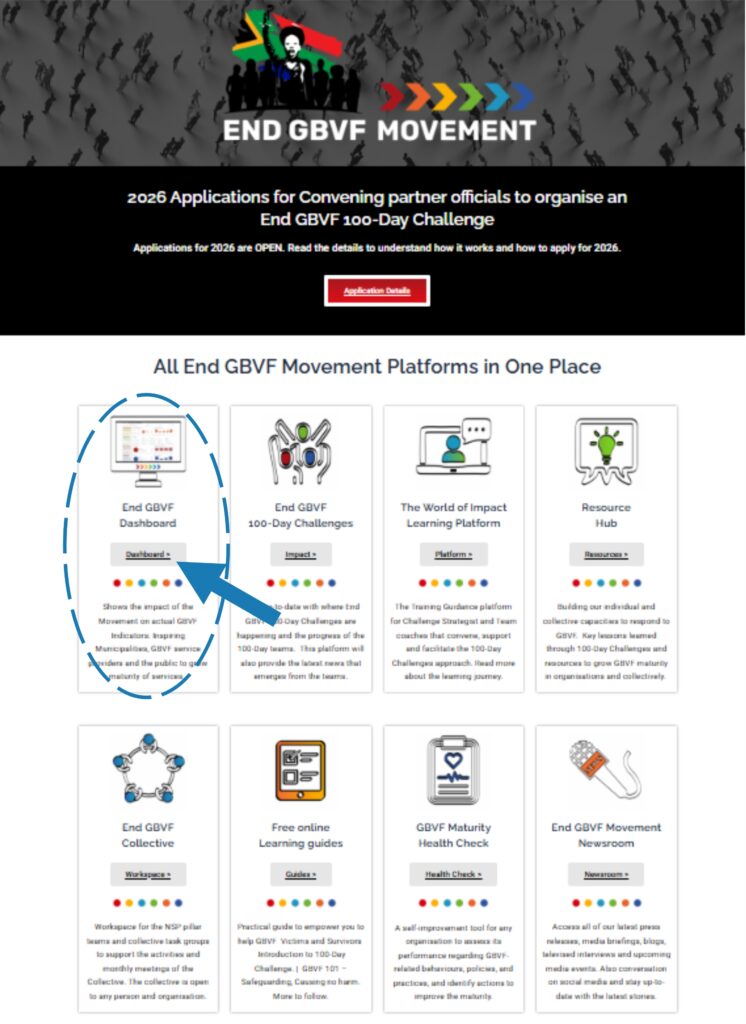
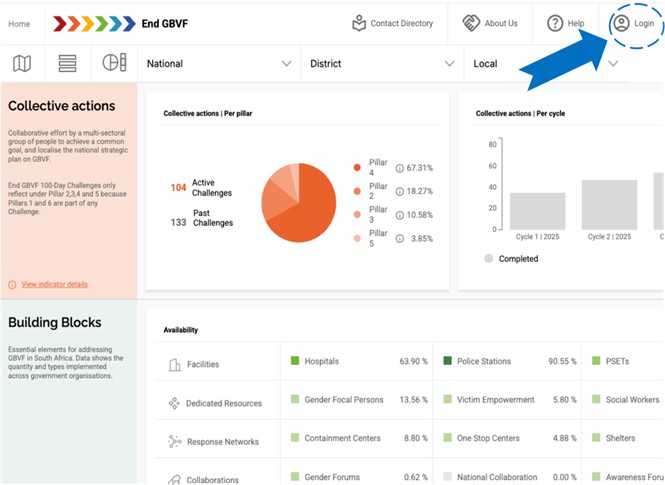
Log in to your organisation profile on the dashboard.
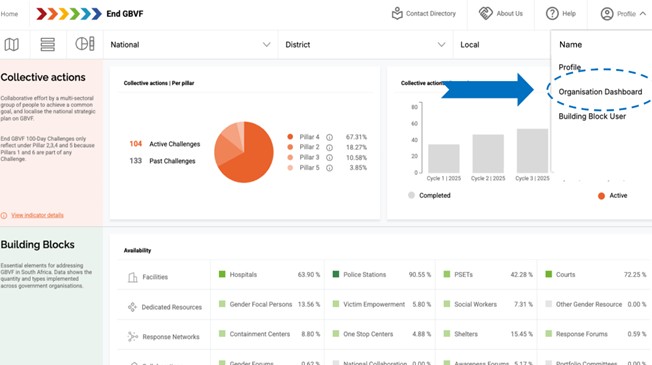
Hover over profile: Click on Organisational Dashboard
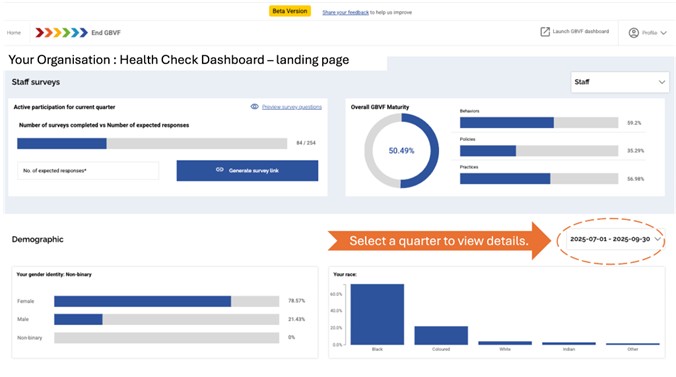
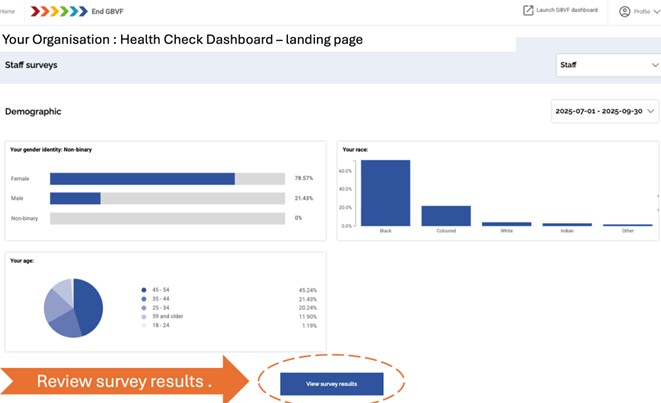
You will likely see the landing page without any data showing. Select the previous quarter from the drop-down menu to see your most recent results.
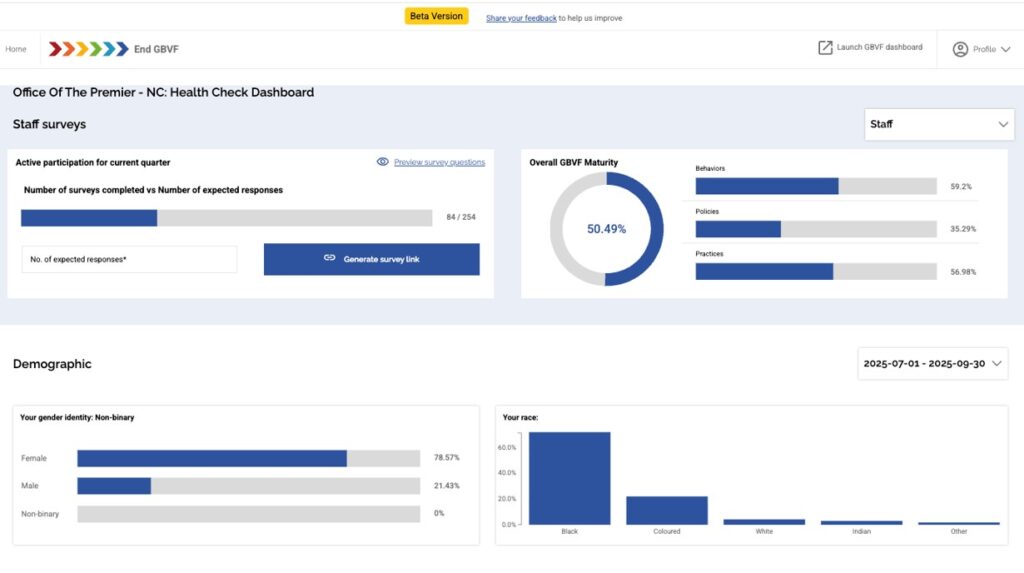
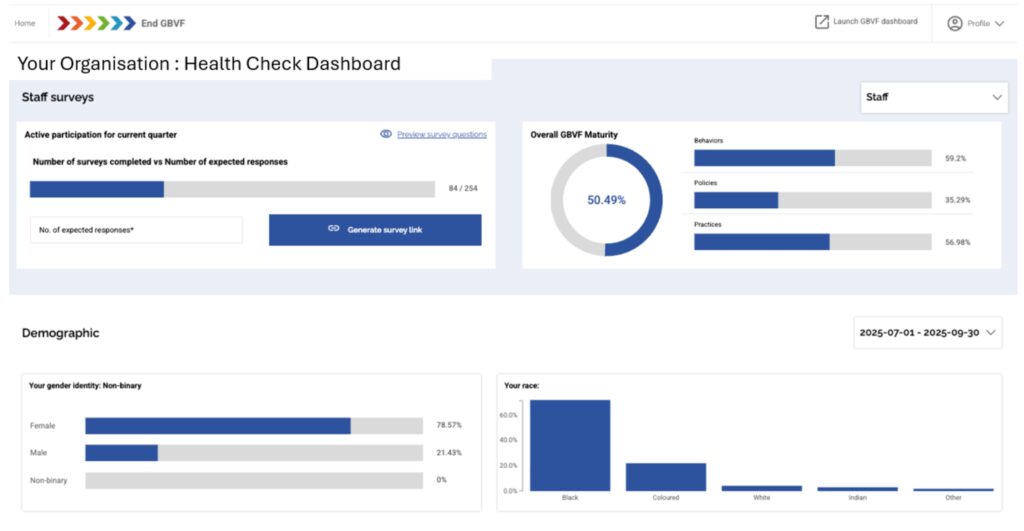
You will see the following summary of your organisation’s GBVF maturity, as well as demographic information about the survey respondents in the organisation. Please take a screen shot of this and insert it into your slide presentation to the leadership group.
Here are points to highlight about the slide when you present it to leaders:
The response rate (percentage of the staff who responded to the survey).
This is shown in the upper left corner of the page. The further the blue line goes, the more reliable the results of the survey
Whether the mix of gender and race of respondents reflects the general make-up of the organisation.
This is shown in the bottom half of the slide. The closer this mix resembles the organisation, the more reliable the data.
The overall GBVF maturity score of the organisation.
This is shown in the top right corner of the slide. You’d like to see this score get higher over time.
As a comparator, the average score of the 27 organisations that have completed the survey in recent months is 60%
Polices, Practices & Behaviours
You will notice that, along with an overall maturity score, there are three sub-scores for Policies, Practices, and Behaviours. The questions of the survey are organised under these three headings.
Policies
Tracks whether proper policies are in place, communicated, and implemented.
Practices
Tracks the practices that the organisation is putting into place to support GBVF-related culture and behaviour shifts; e.g. awareness building, dialogue, and monitoring.
Behaviours
Tracks whether this is all translating into day-to-day behaviours of staff in the workplace.
Overall GBVF Maturity
60 – 100%
Green: Positive
(Strong, consistent GBVF integration)
20 – 59%
Yellow: Neutral but can Improve
(Moderate — foundation exists, but improvement needed)
0 – 19%
Red: Need intervention to improve
(Weak — requires urgent attention and strategic focus)
Step 2: Explore the Detailed Results
Review the main survey results at the bottom of the page
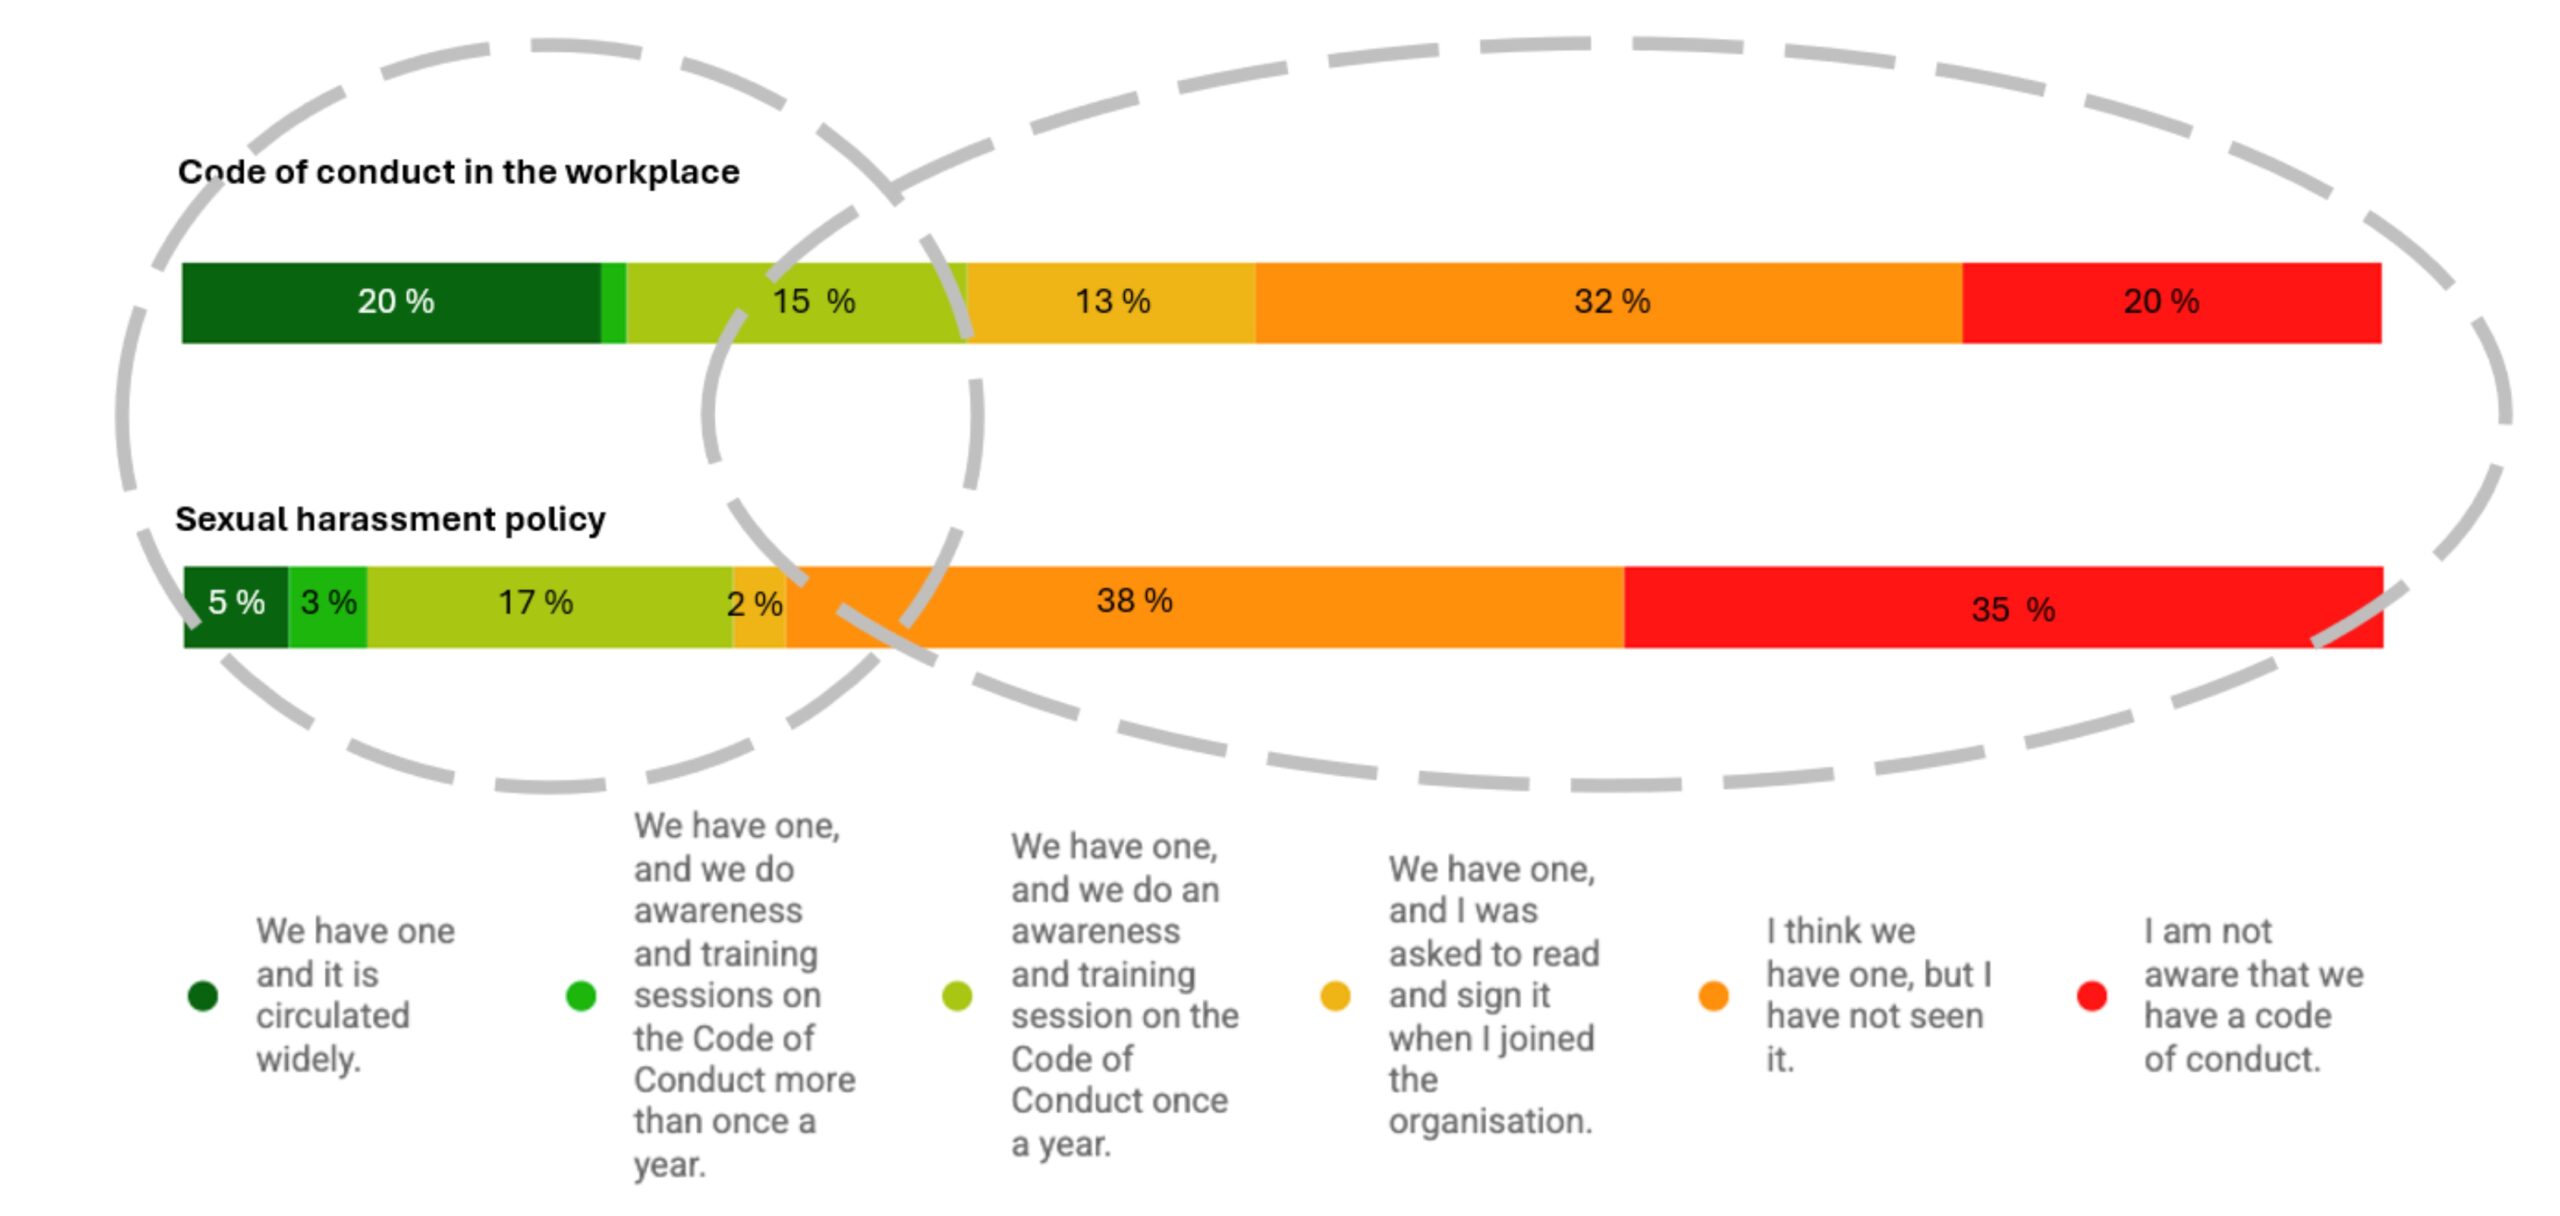
You will see the results for each survey question.
A simple rule of thumb:
More green on the graph = strong performance or good progress.
More amber or red = areas that need attention or improvement.
Key Message:
The colour distribution is an instant visual cue for organisational strengths and challenges.
Read the graph with the legend below for a better understanding.
Participant Activity:
Review the graphs for each question.
Note where your organisation is performing strongly and where it struggles.
Example 1 - Policies
You can see from the second bar that about 73% (35% + 38%) of staff have not seen the sexual harassment policy, and the majority of them do not think it exists. This could be a good candidate for the focus of a 30-Day Project: getting more staff to be familiar with the sexual harassment policy.
Example 2 - Behaviours
Here you can see that about a 1/3 (38%) of the staff believe that victims of sexual offences committed in the organisation do not speak up. And another 1/3 (20% + 10%) believe that when victims speak up, the matter is hushed or handled in an unsatisfactory or disrespectful way (from the victim’s perspective). So increasing the number of victims who speak up may be a good focus area for a 30-Day Project.
Example 3 - Procedures
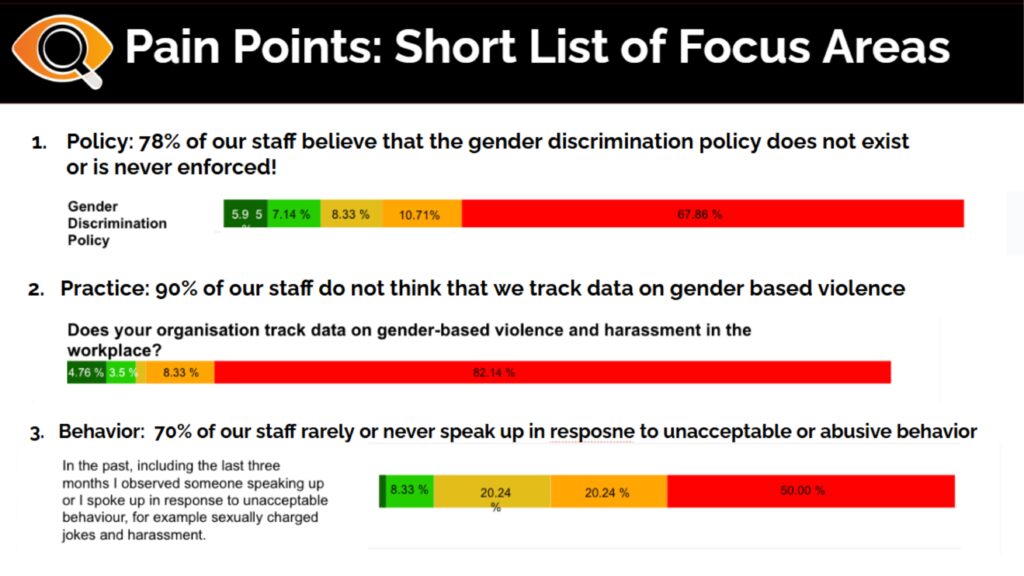
This example suggests that 82% of staff are not aware that the organisation tracks data on gender based violence and harassment in the workplace. If their perception is wrong, this would be an easy fix that does not require a 30-Day Project: If they believe it would help, and it often does, leaders can start publishing this data in the organization’s internal newsletter.
You might ask, where do these percentages in the bar come from? If you hover your cursor over the segment of the bar, you will see the corresponding percentages. You can copy these and insert them on the bar if you are using a screenshot of the bar in your presentation.
Step 3: Identify 3 Big Greens and 3 Big Reds
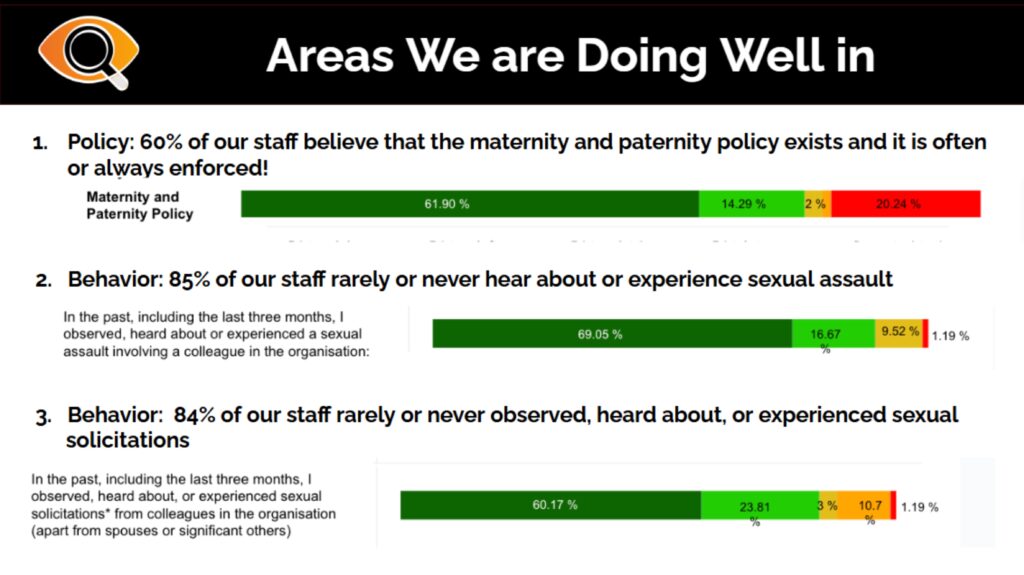
a) High Points: Scan the results, and pick the three that have the longest green bars. Note down the percentages on each green segment of the bar (by hovering over them)
b) Pain Points: Scan the results, and pick the three that have the longest stretch of red/amber/yellow. Use your judgment and discretion to pick something that “feels ripe for action” even if it is not in the top three. Note down the percentages of each of the segments of the bar. Make sure there is at least one behaviour and one policy are on the list.
The Pain Points will be the short list of possible focus areas you will suggest to the leaders. The reason we are insisting on including behaviours and policies on the list is that practices tend to point to specific activities that can become part of the work plan of the team. They are often not good candidates for focus areas for 30-Day Projects, as these ought to be more outcome-oriented.
Step 4: Prepare Survey Slides to Share with Leaders
Slide 1:
The screenshot of the overview of the survey in the organisation, from step 1.
Slide 2:
What we are doing well. Turn the three “high points” from Step 2 above into easy-to-understand bullets.
Slide 3:
Short list of possible focus areas for our 30-Day Project. Turn the three “pain points” you identified in Step 3 above into easy-to-understand bullets.
Jot down thoughts on these questions – to the extent they are relevant to your experience at the session:
When did the mood in the event shift from “why are we here?” to “this could be interesting – I am excited to be part of this.” What triggered this shift?
When did you have to go “off script” on the agenda or to change the agenda? What triggered this? What did you adjust? How did it go?
What was most surprising to you at the event?
What new insights did you gain about the issue at hand, and about the way leaders in the system interacted with each other?
Where did the conversation get stuck? What got it unstuck?
How would you characterise the level of trust among participants in the meeting? To what extent did this shift as the meeting progressed? To what do you attribute this shift, if indeed it happened?
Thought starter...
Reflection Questions
Jot down thoughts on these questions – to the extent they are relevant to your experience at the session:
When did the mood in the event shift from “why are we here?” to “this could be interesting – I am excited to be part of this.” What triggered this shift?
When did you have to go “off script” on the agenda or to change the agenda? What triggered this? What did you adjust? How did it go?
What was most surprising to you at the event?
What new insights did you gain about the issue at hand, and about the way leaders in the system interacted with each other?
Where did the conversation get stuck? What got it unstuck?
These are 100-Day Challenge Mentors.
They did some work before you received the Challenge Note. This included:
Writing the Challenge Note, and making sure that the leaders of all the organisations represented on the team are comfortable with it – and committed to supporting the work of the team
Helping the leaders of these organisation recruit you and your colleagues to the team
Gathering some baseline data and other information that will help you and your teammates set your 100-Day goal and develop your plan.
Making sure all the preparations are made for a successful Lift-Off workshop, when you and your teammates will meet and get your 100-Day Challenge started. This includes venue, facilitation support, food, swags, comms, travel arrangements and whatever else is needed.
Mentors will participate in all or part of the Lift-Off Workshop, mostly at the start to provide context and answer questions, and at the end to give you and your teammates feedback about the goal and plan you develop.
During the 100 days following the Lift-Off Workshop, here’s what the Mentors will do:
They will check in every two weeks with the team leaders to see how the team is doing and what support they and the team need.
They will keep other organisational leaders informed and engaged during the 100 days, and pull them in to help as needed.
They will participate in the last part of the Refuelling Workshop, halfway through the 100 days, to see what additional support the team needs, and to begin to plan with the team for sustainability and scale-up.
They will work with the team at the Sustainability Workshop to finalise recommendations on sustaining the results and building on the work of the team.
Login
Accessing this learning programme requires a login. Please enter your credentials below!